Openpyxl Adding chart to Excel File
- Charts are effective to represent the data. Using the charts, it visualizes the data which may be easily untestable.
- There are various types of chart: chart , line chart, bar chart, and so on. we will draw a chart on a spreadsheet using an openpyxl module.
- For building any chart on the spreadsheet, we'd like to define the chart type like BarChart, LineChart, and so on.

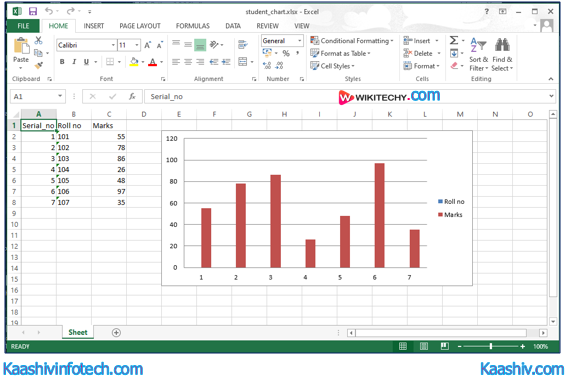
Adding Bar Chart
Sample code
from openpyxl import Workbook
from openpyxl.chart import BarChart, Reference

wb = Workbook()
sheet = wb.active

# Let's create some sample student data
rows = [
    ["Serial_no", "Roll no", "Marks"],
    [1, "101", 55],
    [2, "102", 78],
    [3, "103", 86],
    [4, "104", 26],
    [5, "105", 48],
    [6, "106", 97],
    [7, "107", 35],
]

fori in rows:
sheet.append(i)

chart = BarChart()
values = Reference(worksheet=sheet,
min_row=1,
max_row=8,
min_col=2,
max_col=3)

chart.add_data(values, titles_from_data=True)
sheet.add_chart(chart, "E2")

wb.save("student_chart.xlsx")
Output
Read Also
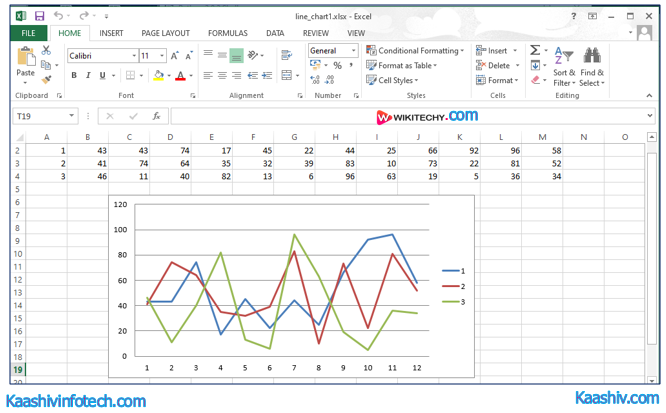
Using line chart

Line Chart
Sample Code
from openpyxl import Workbook
from openpyxl.chart import LineChart, Reference

wb = Workbook()
spreadsheet = wb.active

# Let's create some sample data
rows = [
    ["", "January", "February", "March", "April",
    "May", "June", "July", "August", "September",
     "October", "November", "December"],
    [1, ],
    [2, ],
    [3, ],
]

for row in rows:
spreadsheet.append(row)

for row in spreadsheet.iter_rows(min_row=2,
max_row=4,
min_col=2,
max_col=13):
for cell in row:
        cell.value = random.randrange(5, 100)

chart = LineChart()
data = Reference(worksheet=spreadsheet,
min_row=2,
max_row=4,
min_col=1,
max_col=13)

chart.add_data(data, from_rows=True, titles_from_data=True)
spreadsheet.add_chart(chart, "C6")

wb.save("line_chart1.xlsx")
Output