Jmeter Listeners | jmeter backend listener - jmeter - jmeter tutorial
What is Jmeter Listeners?
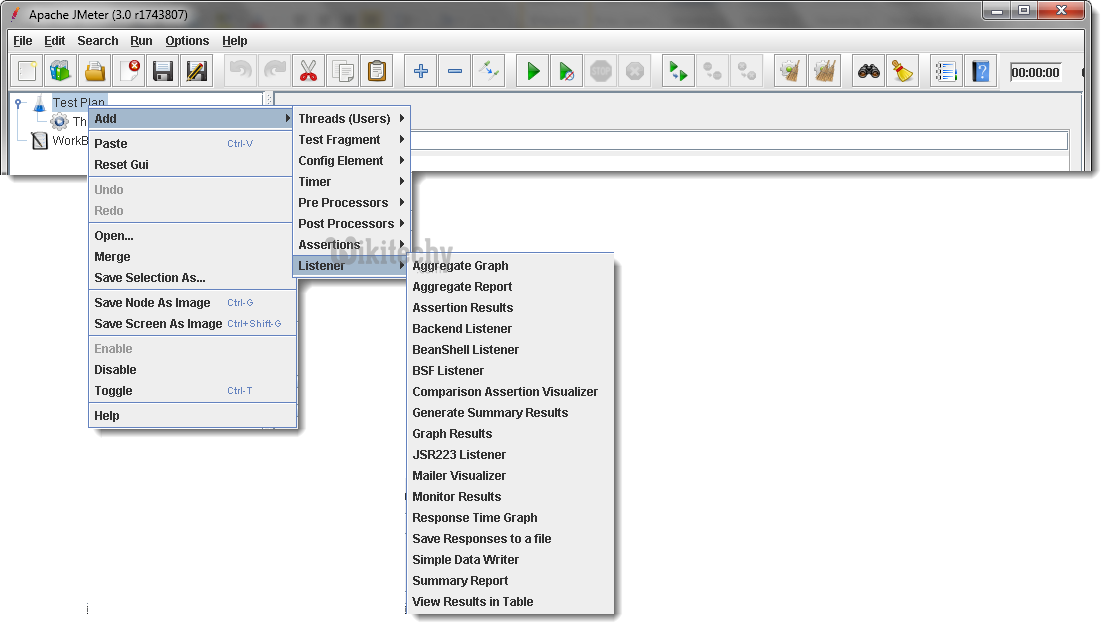
- Listener allows us to view and analyze the Sampler request and response in the form of tables, graphs, trees etc.
- You can also save results in a file and read saved results later. You can access the sampler result in an ongoing load/stress test without waiting till end.
- Listener can be added anywhere in the test plan. It will gather data only from elements defined in its scope.
learn apache jmeter tutorials - jmeter- listeners
- List of listeners is as follows:
- Aggregate Graph
- Aggregate Report
- Assertion Results
- Backend Listener
- BeanShell Listener
- BSF Listener
- Comparison Assertion Visualizer
- Generate Summary Results
- Graph Results
- JSR223 Listener
- Mailer Visualizer
- Monitor Results
- Response Time Graph
- Saves Responses to a file
- Simple Data Writer
- Summary Report
- View Results in Table
- View Results Tree
Let’s have a look on some common types of Listeners:
jmeter tutorials - jmeter load testing - jmeter download - download jmeter - apache jmeter
1. Aggregate Graphs:
- Aggregate graphs allow us to generate bar graphs easily and let us select graph display settings.
- The generated graph and table data can be saved explicitly in the form of PNG and CSV.
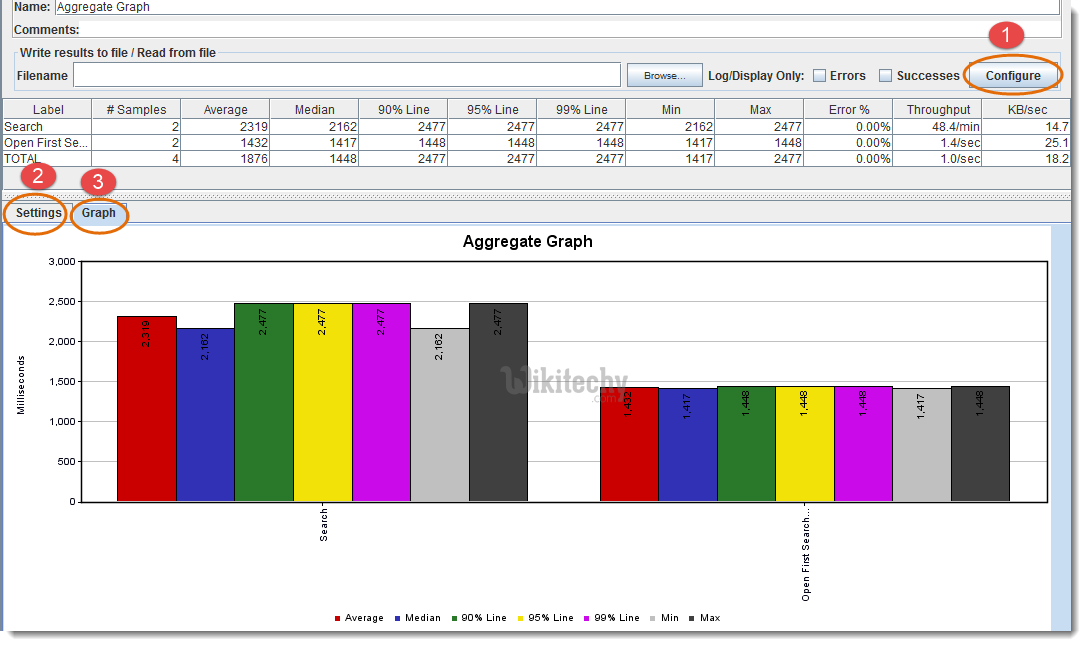
- Sample Result Save Configuration
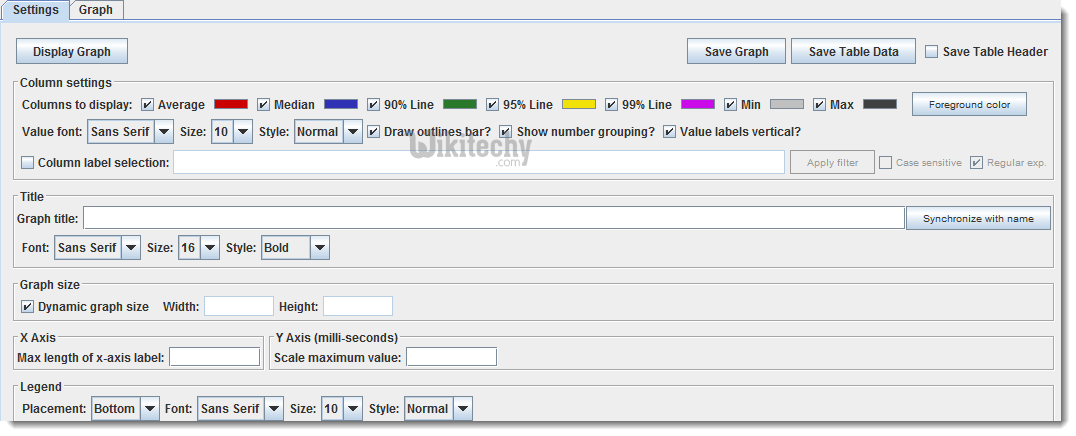
- Settings for the aggregated graph (as you can see in the below figure)
- Graphical Representation.
Aggregate Graph Settings Screen:
2. Aggregate Report:
- Aggregate report shows a separate table row for each differently named sampler request in the test.

jmeter tutorials - jmeter load testing - jmeter download - download jmeter - apache jmeter
3. Assertion Results:
- Assertion Results displays the results of assertions applied on the Sampler.
- You can see in the below figure, if any assertion fails it will look like this.
- Please Note that Assertion Results SHOULD NOT BE USED during Load/Stress test as it consumes a lot of resources like memory and CPU.
- It is recommended to use it with functional testing or debugging purposes.

4. View Results In Table:
- View Results in table creates and displays a row for every sample/request result separately.
- Please Note that View Results In Table SHOULD NOT BE USED during Load/Stress test as it consumes a lot of resources like memory and CPU.
- It is recommended to use it with functional testing or debugging purposes.

5. View Results Tree:
- View Results Tree displays a tree consists of all the Sampler responses along with their requests.
- Please Note that View Results Tree SHOULD NOT BE USED during Load/Stress test as it consumes a lot of resources like memory and CPU.
- It is recommended to use it with functional testing or debugging purposes.
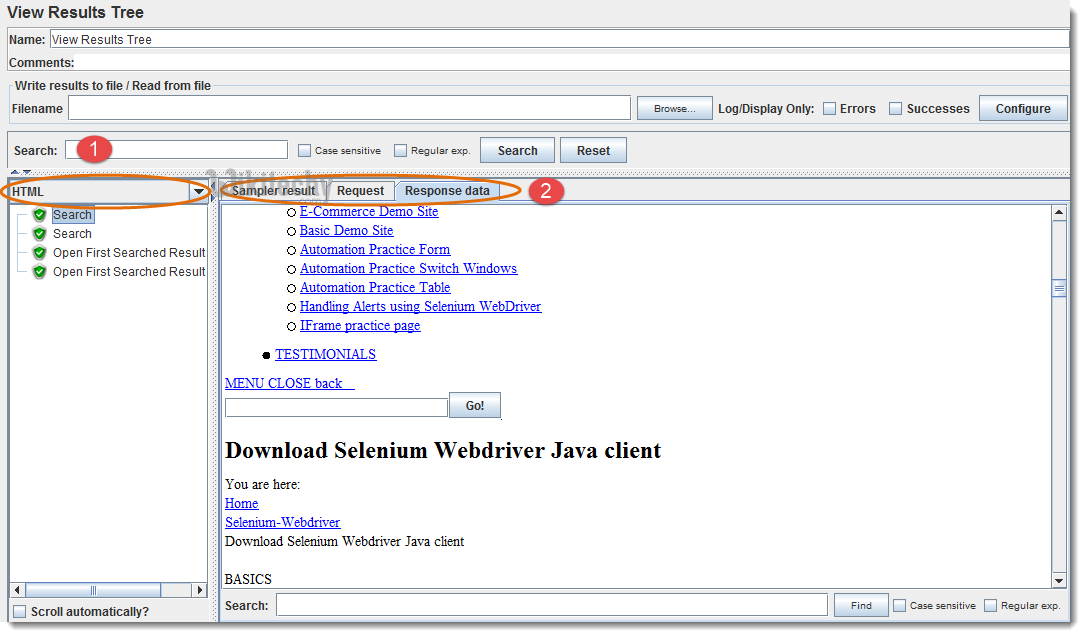
- Select desired response format view from available options in dropdown like Text, RegExp Tester, CSS/JQuery Tester, XPath Tester, HTML, HTML (download resources), Document, JSON
- Select tab Sampler result, Request and Response data
