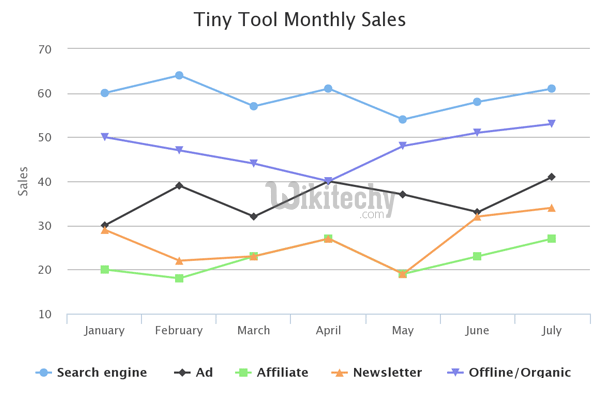
Google Chart - google chart tutorial - Basic Line Chart With visible points - chart js - google graphs - google charts examples
What is Visible Points?
- This corresponds to the requirement that , where denotes the greatest common divisor.
- The plots above show the first few points visible from the origin.
- An invisible figure is a polygon all of whose vertices (with possibly degenerate edges when restricted on a grid) are invisible from the origin.

Learn Google Charts - Google Charts tutorial - Basic Line Chart With Visible Points - Google Charts examples - Google Charts programs
Configuration
- The code which is given below shows us the configuration for basic line chart with visible points and we have added pointVisible configuration to show data points
Code:
// Set chart options
var options = {
   pointsVisible: true
};
Clicking "Copy Code" button to copy the code. From - google charts tutorial - team
- The program which is given below shows us the full program of basic line chart with visible points which is given below:
Example:
googlecharts-line-points.html
Tryit<html>
<head>
<title>Google Charts Tutorial</title>
   <script type="text/javascript" src="https://www.gstatic.com/charts/loader.js"></script>
   <script type="text/javascript">
     google.charts.load('current', {packages: ['corechart','line']});
   </script>
</head>
<body>
<div id="container" style="width: 550px; height: 400px; margin: 0 auto"></div>
<script language="JavaScript">
function drawChart() {
   // Define the chart to be drawn.
   var data = new google.visualization.DataTable();
   data.addColumn('string', 'Month');
   data.addColumn('number', 'Tokyo');
   data.addColumn('number', 'New York');
   data.addColumn('number', 'Berlin');
   data.addColumn('number', 'London');
   data.addRows([
      ['Jan',  7.0, -0.2, -0.9, 3.9],
      ['Feb',  6.9, 0.8, 0.6, 4.2],
      ['Mar',  9.5,  5.7, 3.5, 5.7],
      ['Apr',  14.5, 11.3, 8.4, 8.5],
      ['May',  18.2, 17.0, 13.5, 11.9],
      ['Jun',  21.5, 22.0, 17.0, 15.2],
      ['Jul',  25.2, 24.8, 18.6, 17.0],
      ['Aug',  26.5, 24.1, 17.9, 16.6],
      ['Sep',  23.3, 20.1, 14.3, 14.2],
      ['Oct',  18.3, 14.1, 9.0, 10.3],
      ['Nov',  13.9,  8.6, 3.9, 6.6],
      ['Dec',  9.6,  2.5,  1.0, 4.8]
   ]);

   // Set chart options
   var options = {'title' : 'Average Temperatures of Cities',
      hAxis: {
         title: 'Month'
      },
      vAxis: {
         title: 'Temperature'
      },
      'width':550,
      'height':400,
      pointsVisible: true
   };

   // Instantiate and draw the chart.
   var chart = new google.visualization.LineChart(document.getElementById('container'));
   chart.draw(data, options);
}
google.charts.setOnLoadCallback(drawChart);
</script>
</body>
</html>
