Google Charts - Google Charts tutorial - Stacked Area Chart - chart js - google graphs - google charts examples
What is Stacked Area Chart?
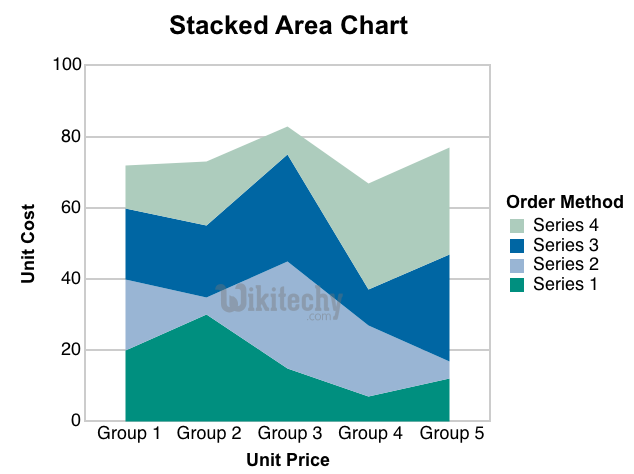
- Stacked Area Graphs work in the same way as simple Area Graphs which is given
- Stacked Area Graphs use the multiple data series that start each point from the point which is left by the previous data series.
- Stacked Area Graphs also use area to convey whole numbers, so else they do not work for negative values.
- Stacked Area Graphs are useful for comparing multiple variables changing over an interval.
Learn GoogleCharts - GoogleCharts tutorial - stacked area graph chart in google charts - GoogleCharts examples - GoogleCharts programs
Configuration:
Here the code which is given below shows us the configuration for Stacked area chart
Code:
// Set chart options
var options = {
   isStacked: true
};
Clicking "Copy Code" button to copy the code. From - google charts tutorial - team
Learn Google chart - Google chart tutorial - Google chart examples - Google chart programs
The program which is given below shows us the full program of stacked area chart which is used.
Program:
googlecharts-area-stacked.html
 Tryit <html>
<head>
<title>Google Charts Tutorial</title>
   <script type="text/javascript" src="https://www.gstatic.com/charts/loader.js"></script>
   <script type="text/javascript">
     google.charts.load('current', {packages: ['corechart']});
   </script>
</head>
<body>
<div id="container" style="width: 550px; height: 400px; margin: 0 auto"></div>
<script language="JavaScript">
function drawChart() {
   // Define the chart to be drawn.
   var data = google.visualization.arrayToDataTable([
      ['Year', 'Asia', 'Europe'],
      ['2013',  1000,      400],
      ['2014',  1170,      460],
      ['2015',  1300,       480],
      ['2016',  1530,      540]
      ]);
   var options = {
      title: 'Population (in millions)',
      hAxis: {
         title: 'Year',
         titleTextStyle: {
            color: '#333'
         }
      },
      vAxis: {
         minValue: 0
      },
	  isStacked: true
   };

   // Instantiate and draw the chart.
   var chart = new google.visualization.AreaChart(document.getElementById('container'));
   chart.draw(data, options);
}
google.charts.setOnLoadCallback(drawChart);
</script>
</body>
</html>