Google Charts - Google Charts tutorial - Timelines Chart with data labels - chart js - google graphs - google charts examples
What is Timelines Chart with data labels?
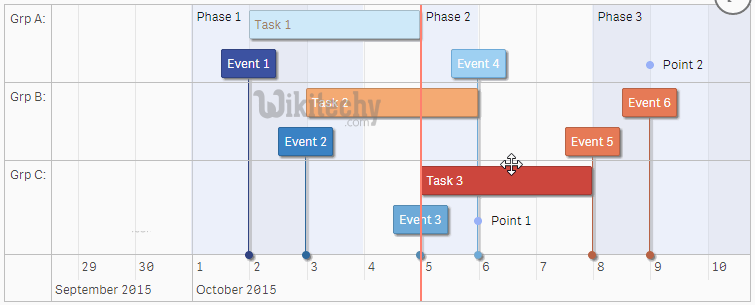
- A timeline is a chart that shows how a set of resources are used over time.
- If we're managing a software project and want to illustrate who is doing what and when, or if you're organizing a conference and need to schedule meeting rooms, a timeline is often a reasonable visualization choice.
- One popular type of timeline is the Gantt chart.

Learn google charts - google charts tutorial - google charts timelines chart with data labels - google charts examples - google charts programs
Configurations
Syntax
//Timeline chart
var chart = new google.visualization.Timeline(document.getElementById('container'));
Clicking "Copy Code" button to copy the code. From - google charts tutorial - team
Sample Code
googlecharts-timelines-labels.html
 Tryit
<html>
<head>
<title>Google Charts Tutorial - Wikitechy</title>
   <script type="text/javascript" src="https://www.gstatic.com/charts/loader.js"></script>
   <script type="text/javascript" src="https://www.google.com/jsapi"></script>
   <script type="text/javascript">
     google.charts.load('current', {packages: ['timeline']});
   </script>
</head>
<body>
<div id="container" style="width: 650px; height: 500px; margin: 0 auto"></div>
<script language="JavaScript">
function drawChart() {
   // Define the chart to be drawn.
   var data = new google.visualization.DataTable();
   data.addColumn({ type: 'string', id: 'President' });
   data.addColumn({ type: 'string', id: 'Name' });
   data.addColumn({ type: 'date', id: 'Start' });
   data.addColumn({ type: 'date', id: 'End' });
   data.addRows([
      [ '1', 'Arnold', new Date(1689, 3, 30), new Date(1697, 2, 4) ],
      [ '2', 'James',      new Date(1697, 2, 4),  new Date(1701, 2, 4) ],
      [ '3', 'Vincent',  new Date(1701, 2, 4),  new Date(1709, 2, 4) ]]);

   var options = {
      width: '50%',
	  height: '50%'
   };

   // Instantiate and draw the chart.
   var chart = new google.visualization.Timeline(document.getElementById('container'));
   chart.draw(data, options);
}
google.charts.setOnLoadCallback(drawChart);
</script>
</body>
</html>
