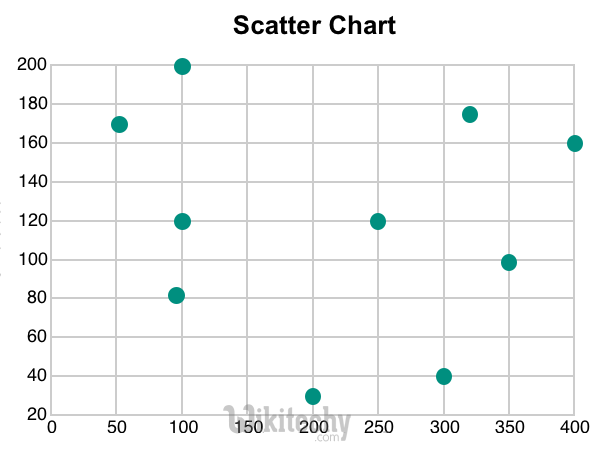
Google Charts - Google Charts tutorial - Scatter Chart - chart js - google graphs - google charts examples
What are Scatter Charts?
- Scatter Charts is a type of mathematical diagram which is done using Cartesian coordinates to display values for two variables
- Scatter Charts are similar to line graphs where they use horizontal and vertical axes to plot data points
- Scatter Charts show us as per how much one variable is affected by another and the relationship between two variables is called correlation.
- Scatter Charts are used when one continuous variable is under the control of the experiment and the other continuous variable depends on the control of the experiment or else when both continuous variables are independent.
- Scatter Charts can suggest various kinds of correlations between variables with a certain confidence interval.

Learn Googlecharts - Googlecharts tutorial - scatter chart graph in google charts - Googlecharts examples - Googlecharts programs
The table which is given below tells us about scatter chart and their description
| S. No. | Chart Type / Description |
|---|---|
| 1 | Basic Scatter Basic scatter chart |
| 2 | Material Scatter Chart Material Scatter Chart |
| 3 | Dual Y Axis Scatter Chart Material Scatter Chart having dual Y-Axis |
| 4 | Top X Axis Scatter Chart Material Scatter Chart having X-Axis on top. |
