Google Charts - Google Charts tutorial - Gantt Charts - chart js - google graphs - google charts examples
What is Google Gantt Charts?
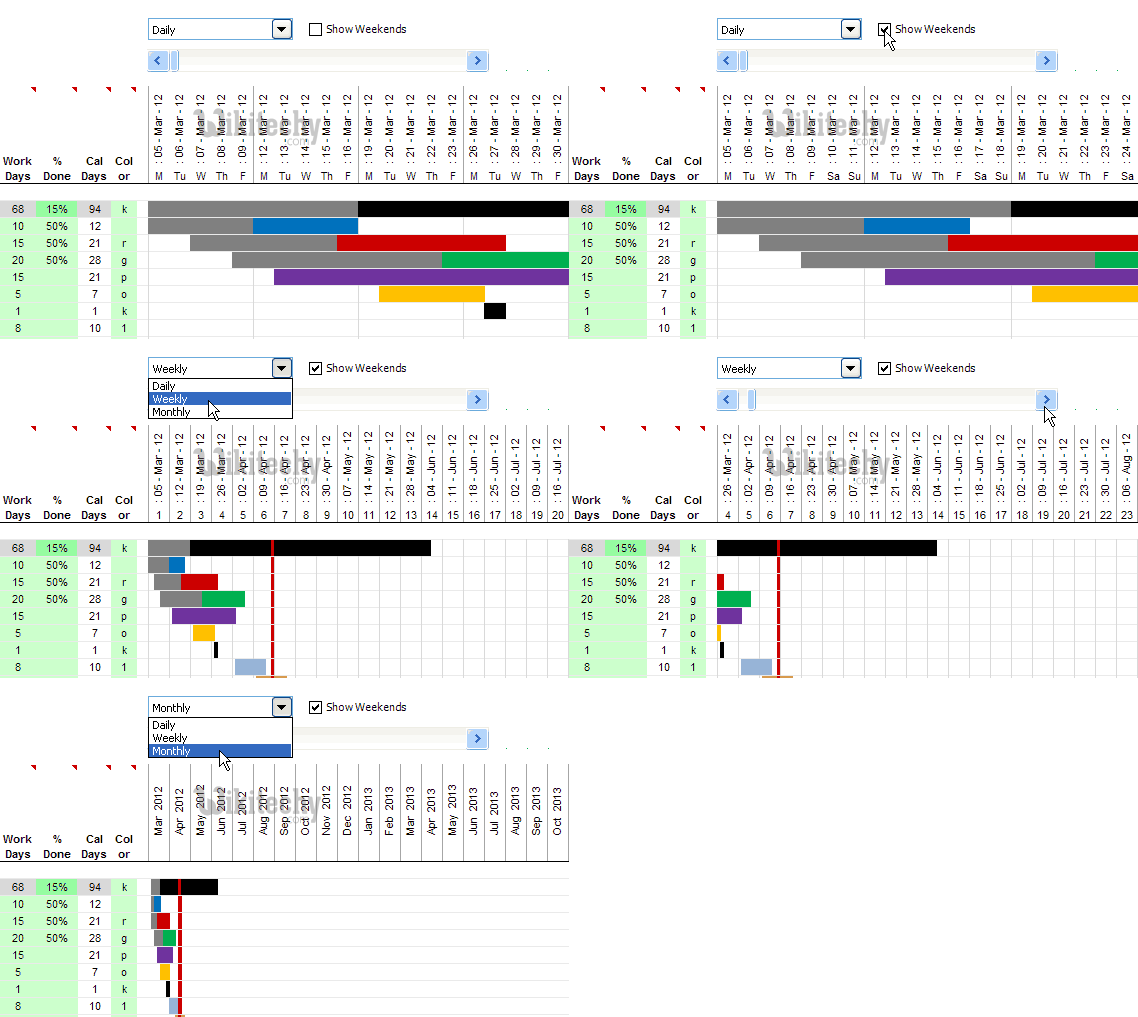
- A Gantt chart is a type of chart that illustrates the breakdown of a project into its component tasks.
- Google Gantt charts illustrate the start, end, and duration of tasks within a project, as well as any dependencies a task.
- Google Gantt charts are rendered in the browser using SVG.
- Similar to all Google charts, Gantt charts display tooltips when the user hovers over the data.

Learn google charts - google charts tutorial - gantt-chart-templatex - google charts examples - google charts programs
Syntax
- The
google.charts.loadpackage name is"gantt". google.charts.load("current", {packages: ["gantt"]});- The visualization's class name is
google.visualization.Gantt. -
var chart = new google.visualization.Gantt(container);
Data policy
- All code and data are processed and rendered in the browser. No data is sent to any server.
Sample Code
 Tryit<html>
<head>
  <script type="text/javascript" src="https://www.gstatic.com/charts/loader.js"></script>
  <script type="text/javascript">
    google.charts.load('current', {'packages':['gantt']});
    google.charts.setOnLoadCallback(drawChart);

    function daysToMilliseconds(days) {
      return days * 24 * 60 * 60 * 1000;
    }

    function drawChart() {

      var data = new google.visualization.DataTable();
      data.addColumn('string', 'Task ID');
      data.addColumn('string', 'Task Name');
      data.addColumn('date', 'Start Date');
      data.addColumn('date', 'End Date');
      data.addColumn('number', 'Duration');
      data.addColumn('number', 'Percent Complete');
      data.addColumn('string', 'Dependencies');

      data.addRows([
        ['Research', 'Find sources',
         new Date(2017, 0, 2), new Date(2017, 0, 6), null,  110,  null],
        ['Write', 'Write paper',
         null, new Date(2017, 0, 10), daysToMilliseconds(3), 35, 'Research,Outline'],
        ['Cite', 'Create bibliography',
         null, new Date(2017, 0, 8), daysToMilliseconds(1), 30, 'Research'],
        ['Complete', 'Hand in paper',
         null, new Date(2017, 0, 11), daysToMilliseconds(1), 10, 'Cite,Write'],
        ['Outline', 'Outline paper',
         null, new Date(2017, 0, 7), daysToMilliseconds(1), 110, 'Research']
      ]);

      var options = {
        height: 175
      };

      var chart = new google.visualization.Gantt(document.getElementById('chart_div'));

      chart.draw(data, options);
    }
  </script>
</head>
<body>
  <div id="chart_div"></div>
</body>
</html>
Clicking "Copy Code" button to copy the code. From - google charts tutorial - team
Output
Benefits of Using Gantt Charts
- There are many good reasons to use a Gantt chart to visualize work and projects. Gantt charts:
- Provide an at-a-glance view of project schedules, so team members and managers can stay on track.
- Facilitate project management and collaboration.
- Allow managers to identify past-due tasks and project delays, so they can take proactive measures.
- Are an effective tool for communicating with team members, executives, and stakeholders, since they make it easy to visualize progress and the completion of milestones and deliverables.
- Are a key tool in project planning, as they help managers determine the minimum time required to complete the project on schedule.
- Show the impact of real or potential scheduling and resource changes.
- Help you verify that your schedule is accurate and realistic.
- Allow you to ensure the right people are assigned to the right tasks and are available when needed.
