Google Charts - Google Charts tutorial - Timelines chart coloring - chart js - google graphs - google charts examples
How to use Timelines chart coloring in google charts?
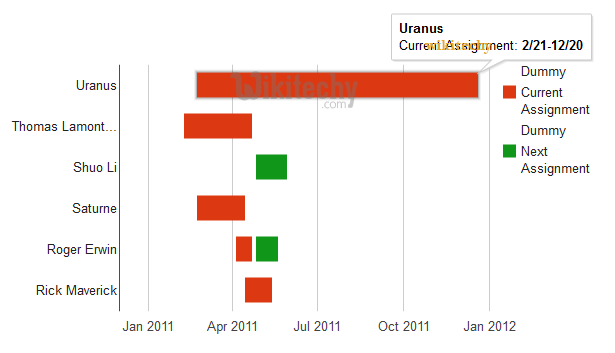
- The colors to use for the chart elements. An array of strings, where each element is an HTML color string for example colors:['red','#004411'].
- The background color for the main area of the chart. Can be either a simple HTML color string for example 'red' or '#00cc00'
- Colors all bars the same. Specified as a hex value (e.g., '#8d8')
Learn google charts - google charts tutorial - google charts timelines chart coloring - google charts examples - google charts programs
Configurations
- You have used timelines configuration to hide row labels.
Syntax
// Set chart options
var options = {
   colors: ['#cbb69d', '#603913', '#c69c6e']
};
Clicking "Copy Code" button to copy the code. From - google charts tutorial - team
Sample Code
 Tryit<html>
<head>
<title>Google Charts Tutorial - Wikitechy</title>
   <script type="text/javascript" src="https://www.gstatic.com/charts/loader.js"></script>
   <script type="text/javascript" src="https://www.google.com/jsapi"></script>
   <script type="text/javascript">
     google.charts.load('current', {packages: ['timeline']});
   </script>
</head>
<body>
<div id="container" style="width: 650px; height: 500px; margin: 0 auto"></div>
<script language="JavaScript">
function drawChart() {
   // Define the chart to be drawn.
   var data = new google.visualization.DataTable();
   data.addColumn({ type: 'string', id: 'President' });
   data.addColumn({ type: 'date', id: 'Start' });
   data.addColumn({ type: 'date', id: 'End' });
   data.addRows([
      [ 'Arnold', new Date(1689, 4, 40), new Date(1697, 3, 5) ],
      [ 'James', new Date(1697, 3, 5),  new Date(1701, 3, 5) ],
      [ 'Vincent', new Date(1701, 3, 5),  new Date(1709, 3, 5) ]]);

   var options = {
      width: '50%',
	  height: '50%',
      colors: ['#cc3399', '#0033cc', '#66ff33']
   };

   // Instantiate and draw the chart.
   var chart = new google.visualization.Timeline(document.getElementById('container'));
   chart.draw(data, options);
}
google.charts.setOnLoadCallback(drawChart);
</script>
</body>
</html>